0out of 100
Below Average

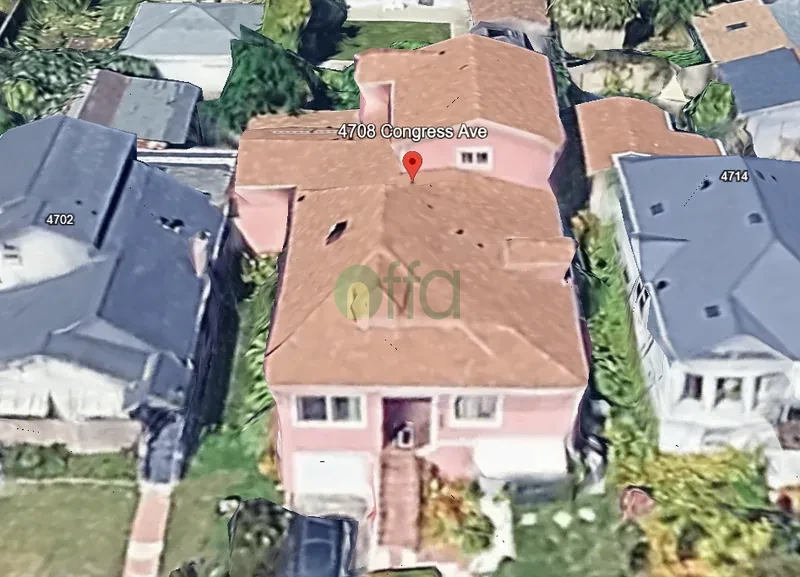
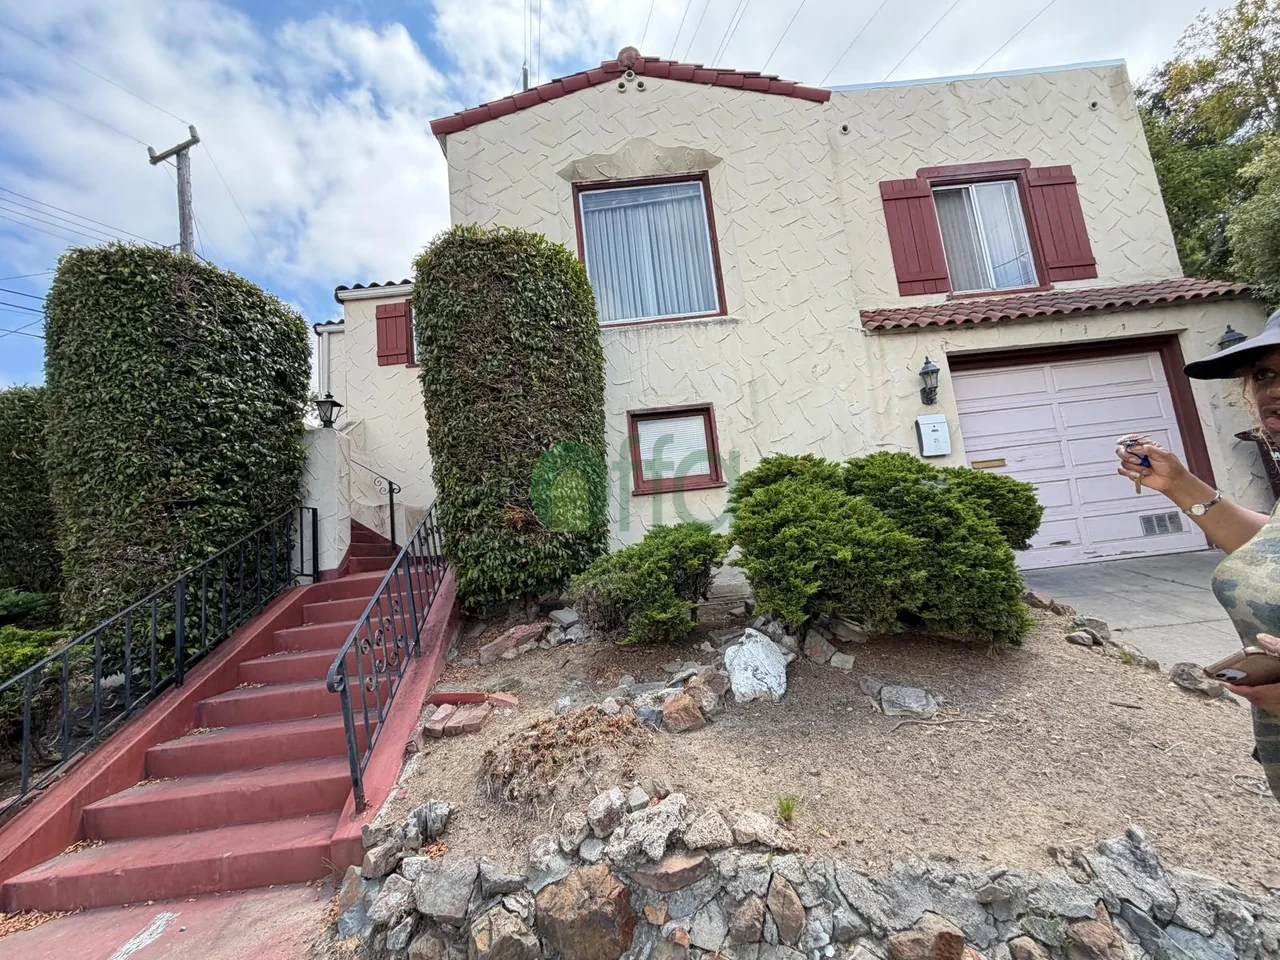
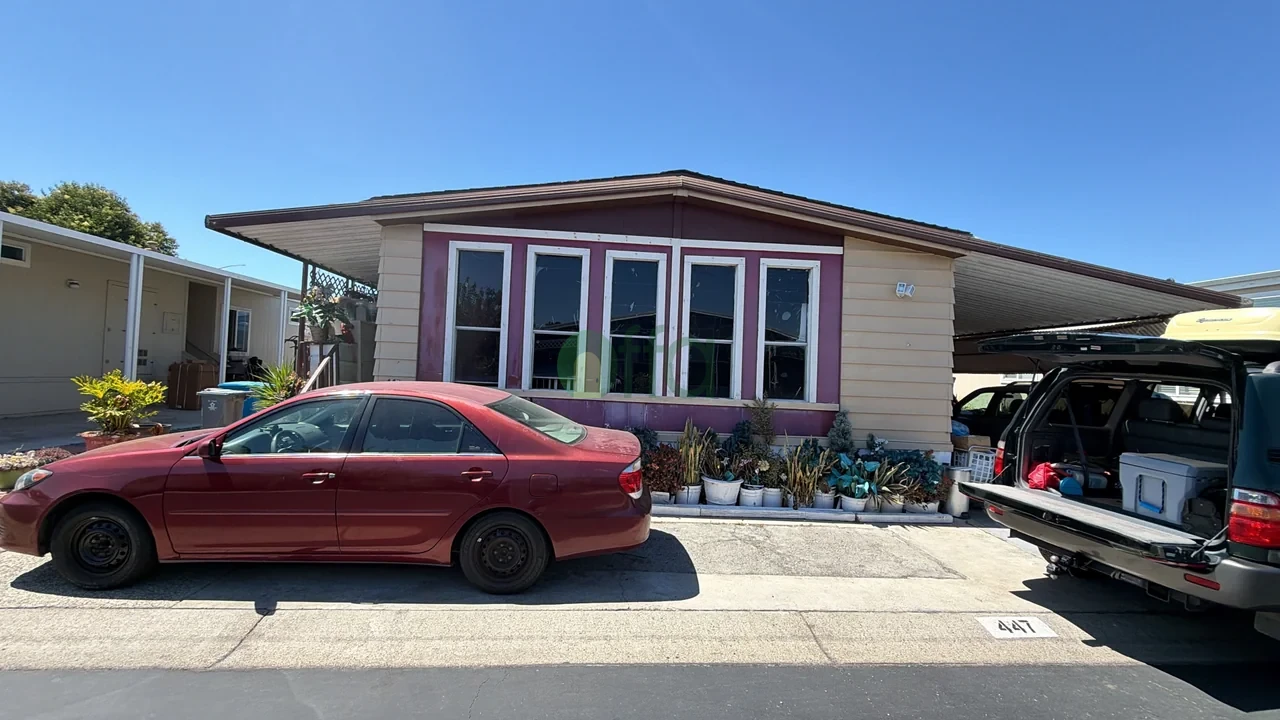
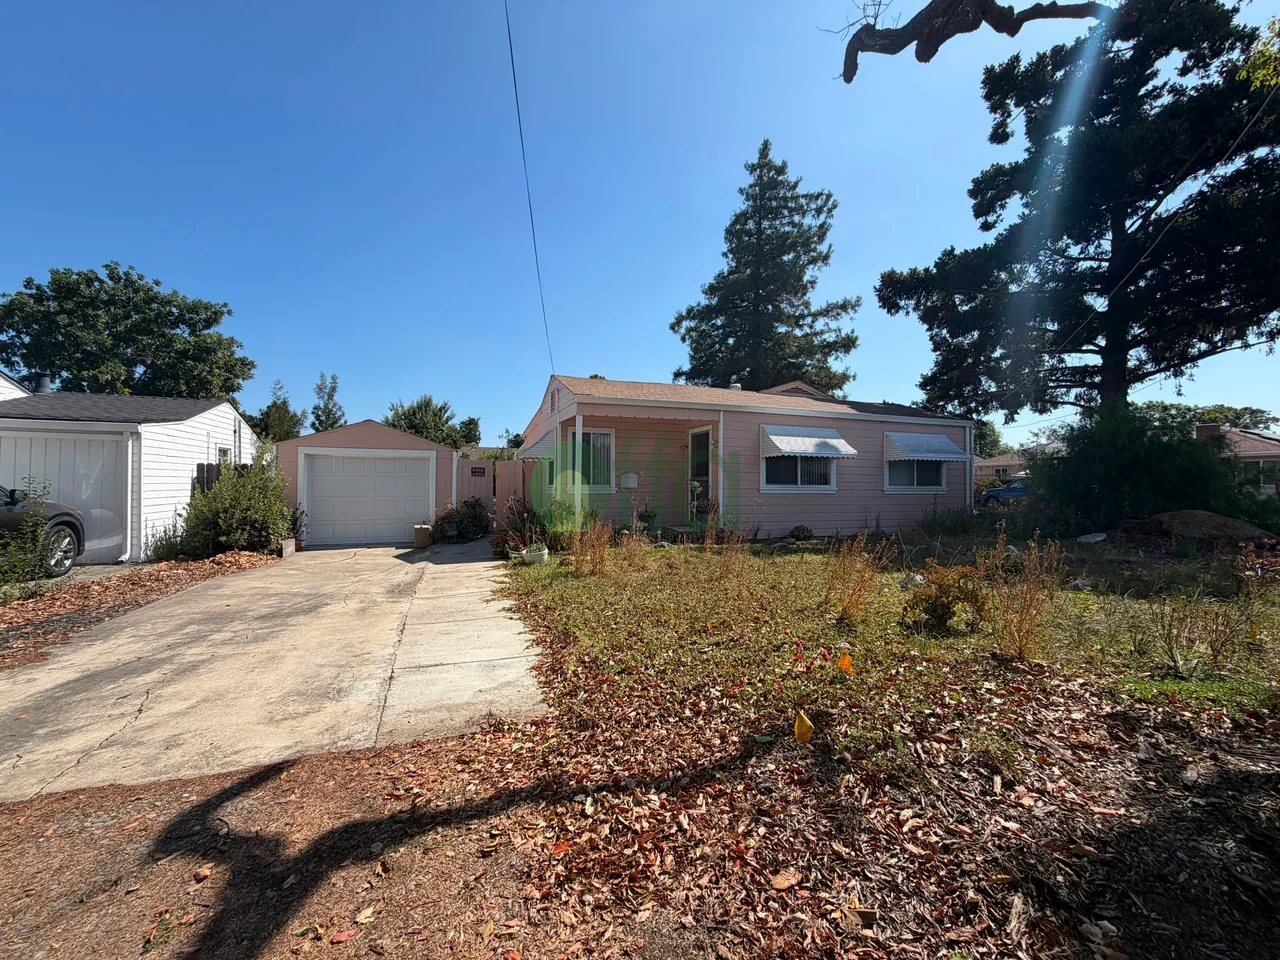
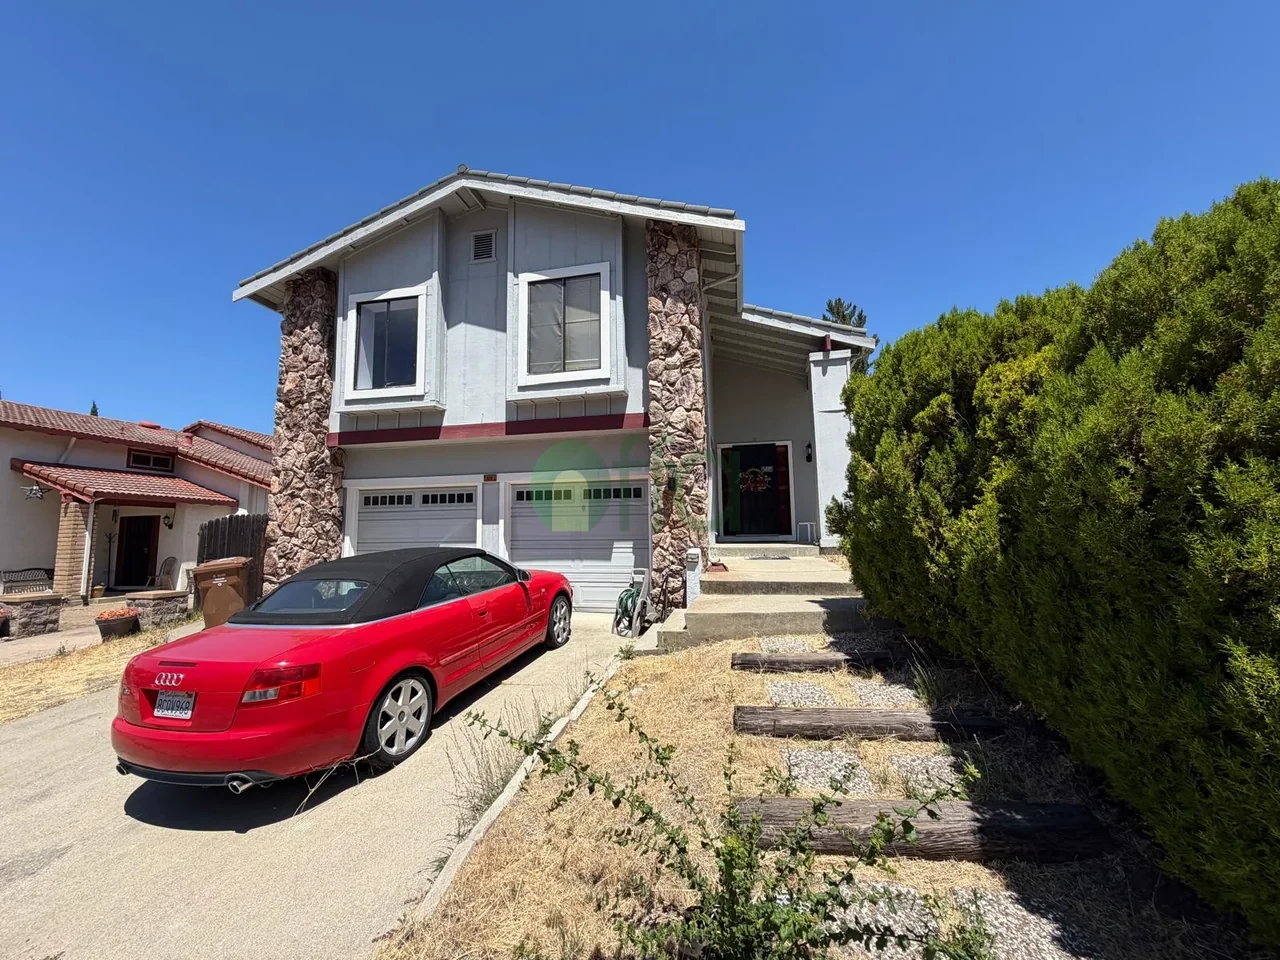
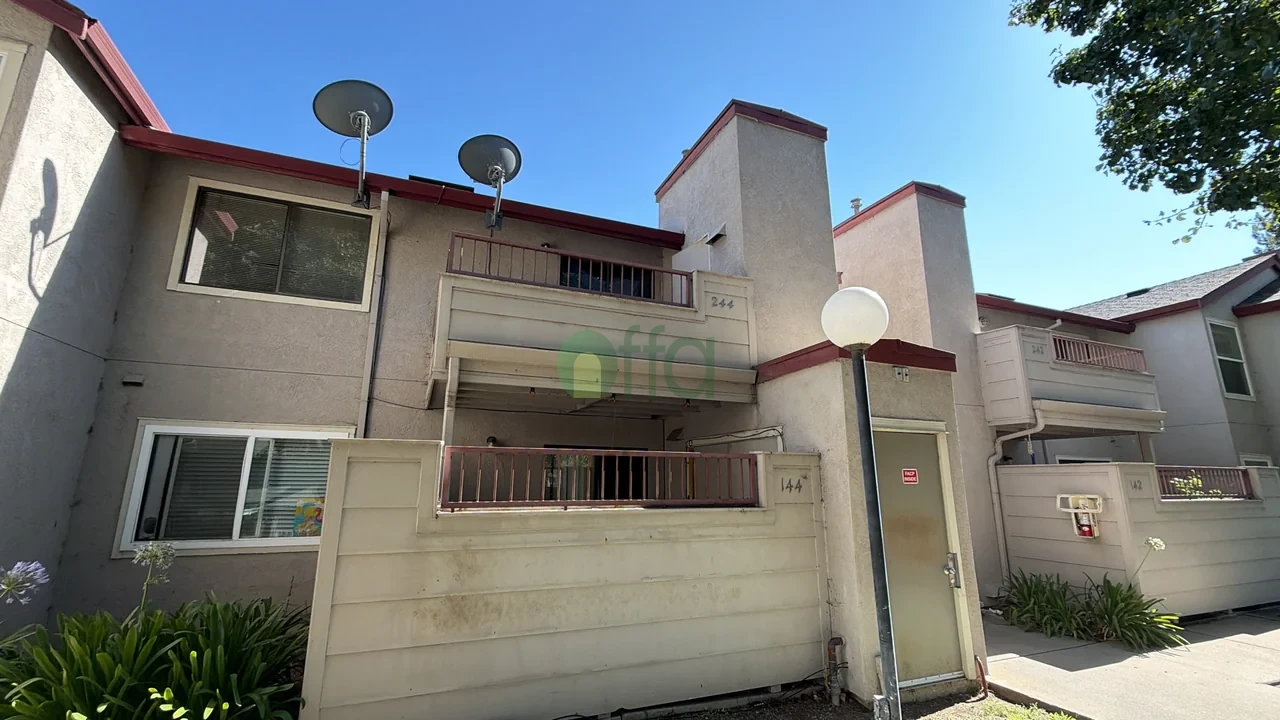
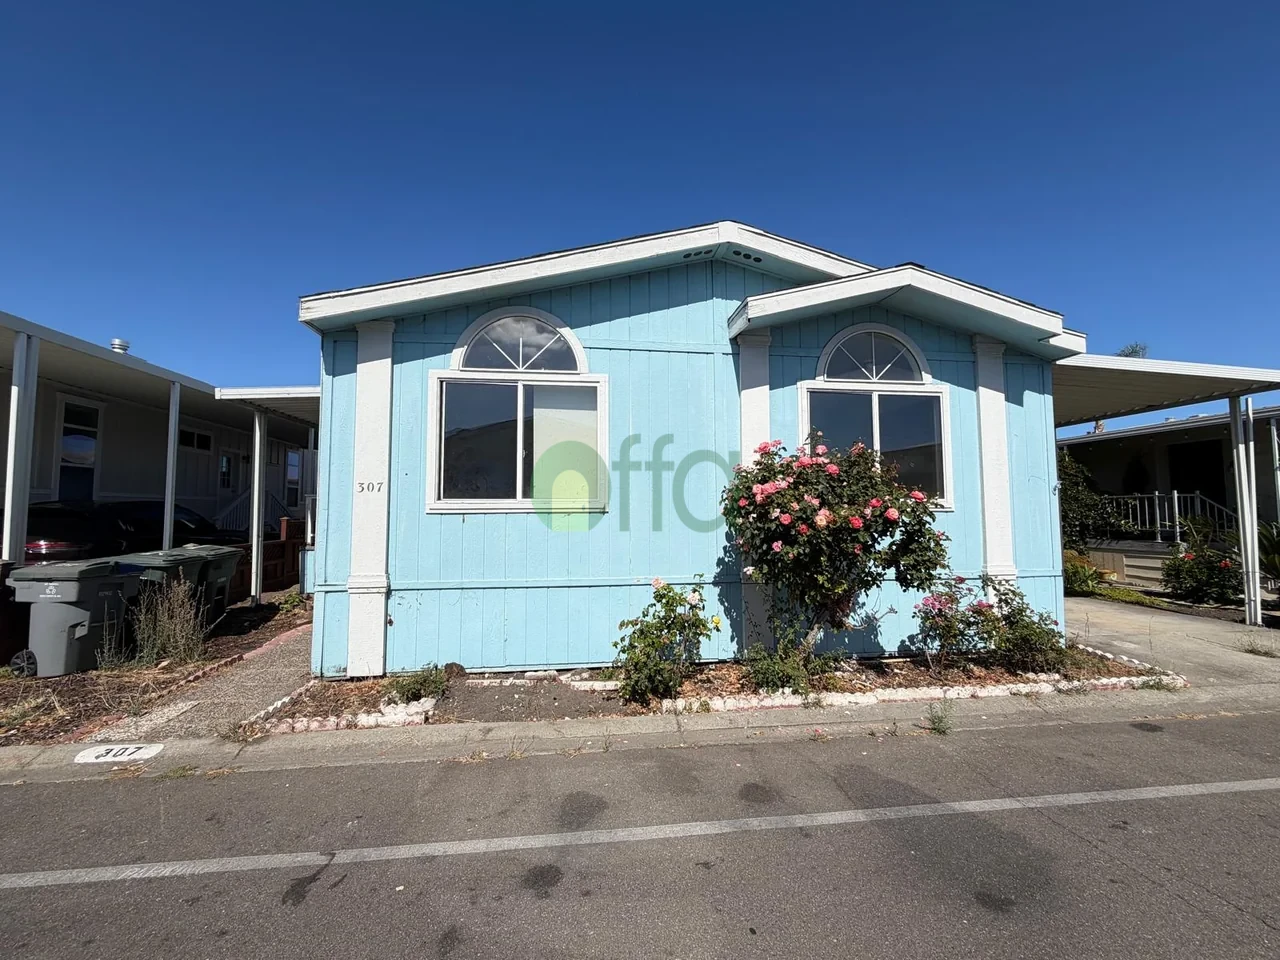
9851 Olive Street, Oakland, CA, USA

Score Breakdown
Value13/40
Cash Flow3/35
Location17/25
$
$350,000
%
$70,000 cash at risk up front
33
9851 Olive Street, Oakland, CA, USA
2 bd1 ba

Below Average

33/100

This deal is below average. Watch that the price sits above market monthly cash flow is negative.

Highlights
  • Stable, average-risk fundamentals
Watch-outs
  • Priced 91% above market
  • $468/mo negative cash flow
  • Cap rate only 3.32%
  • No equity after repairs
  • Neighborhood scores 68/100

Price vs. Market

Needs Work
Your offer
$221/sqft
Area avg
$116/sqft
91% above market average
Your offer
$350,000
At market rate
$183,976

ARV Assessment

Needs WorkAI Estimate
ARV Low
$170k
Est. ARV
$191k
ARV High
$214k
Total Investment
$350k
Est. ARV
$191k
Rehab Cost
$7k
Potential Equity
$-159k
Comparable Reasoning

Based on 5 recent sales within 0.5 miles, comparable condo homes of similar size traded between $170k and $214k. The subject's 1,586 sqft and 2bd/1ba layout supports a midpoint estimate of $191k.

2 more details
Condition Assessment

Property presents in full gut condition. Estimated rehab of $7k covers structural, mechanical, and full interior.

Methodology

Sales-comparison approach weighted by recency, proximity, and price-per-sqft, adjusted for condition and lot. Confidence: moderate.

Moderate confidenceNo photos analyzed
ARV & comps — see the full analysis on Offa

Rental Income

Needs WorkAI Estimate
Rent Low
$1,620
Est. Rent/mo
$1,760
Rent High
$1,940
Monthly Rent
$1,760
Annual Rent
$21k
Rental Yield
6.0%
Cap Rate
3.3%
Market Assessment

The Oakland rental market shows strong demand. Median area rent is $1,838/mo with a 5% vacancy rate.

2 more details
Comparable Reasoning

Comparable 2bd units nearby rent for $1,620–$1,940. At $1,760/mo the gross yield is 6.03% of the purchase price.

Methodology

Rent estimated from active and leased comps adjusted for size, condition, and submarket trends.

Rental analysis — see the full analysis on Offa

Financing Calculator

Needs WorkLive rate · Freddie Mac
Using the current 7.03% 30-yr fixed national average (as of 2026-09-24). Adjust below to match your quote.
Price
$350,000
Loan
$280,000
$70,000
%
%
↓ Monthly Costs
↑ Income Potential
Principal + Interest$1,868/mo
Estimated Rent$1,760/mo
Taxes + Insurance$360/mo
Cash-on-Cash Return-8.02%
Total Payment
$2,228/mo
Monthly Cash Flow
$-468/mo
Negative cash flow: $468/mo
Monthly expenses exceed rental income. Consider a lower offer, larger down payment, or higher rent.

Neighborhood Profile

Needs WorkLive Data
CTier
Emerging Neighborhood50/100
Composite socioeconomic score
Median Income
$71k
Median Home
$596k
Median Rent
$1,838/mo
Homeownership
46.24%
Vacancy
5.37%
Population
36,440
Score Breakdown
Income & Wealth
47
Housing Market
64
Education
20
Employment
52
Stability
60
Infrastructure
61
Neighborhood data — see the full analysis on Offa

City Population

GoodLive Data
Oakland, CA
10-year population trend
+8.9% / decade
City Population
438,072
Density / sq mi
7,828
Area (sq mi)
56
Within 1 Mile
11,084
1-Mile Density
3,528
Trend Years
2014–2023

Get alerts for deals like this in Oakland

We'll email you when matching off-market deals hit Offa's marketplace.

Similar Off-Market Deals Nearby